At E2M, we combine innovation with deep environmental expertise to deliver accurate, actionable insights. From cutting-edge bioacoustic and image detection models to tailored data analytics, we’re helping clients make confident decisions – faster and with greater clarity.
As demand for these capabilities grows, so does our team. We’re excited to welcome Josh, who brings deep technical expertise and a fresh perspective to our Environmental Analytics capability. With a PhD focused on using drones and machine learning to survey bird populations, Josh is bridging engineering and ecology in innovative ways. At our recent Town Hall, he shared more about how our analytics offering continues to support better environmental outcomes and make big project small.
Analytics in Action
Environmental analytics gives us powerful ways to visualise and interpret ecological patterns. In a recent example, we deployed 28 acoustic sensors across a site and found high levels of black-throated finch activity at 7 of these sites. This activity began just after sunrise and tapered off around sunset. By comparing call time to background noise, we identified not just presence but also behaviour, timing, and intensity.
That level of detail helps our clients:
- Measure the impact of management actions
- Optimise survey timing
- Track compliance and conservation progress
- Justify investment in biodiversity outcomes
How the Models Work
To process audio data, we first convert the audio into an image representing the intensity of the sound at different frequencies over time. These images are then analysed using image classification models.
Our models use a well-established machine learning technique called convolutional neural networks. Partly based on how the human brain processes visual information, these models first identify simple features within images, such as lines and edges, then merge these into more complex features like objects.
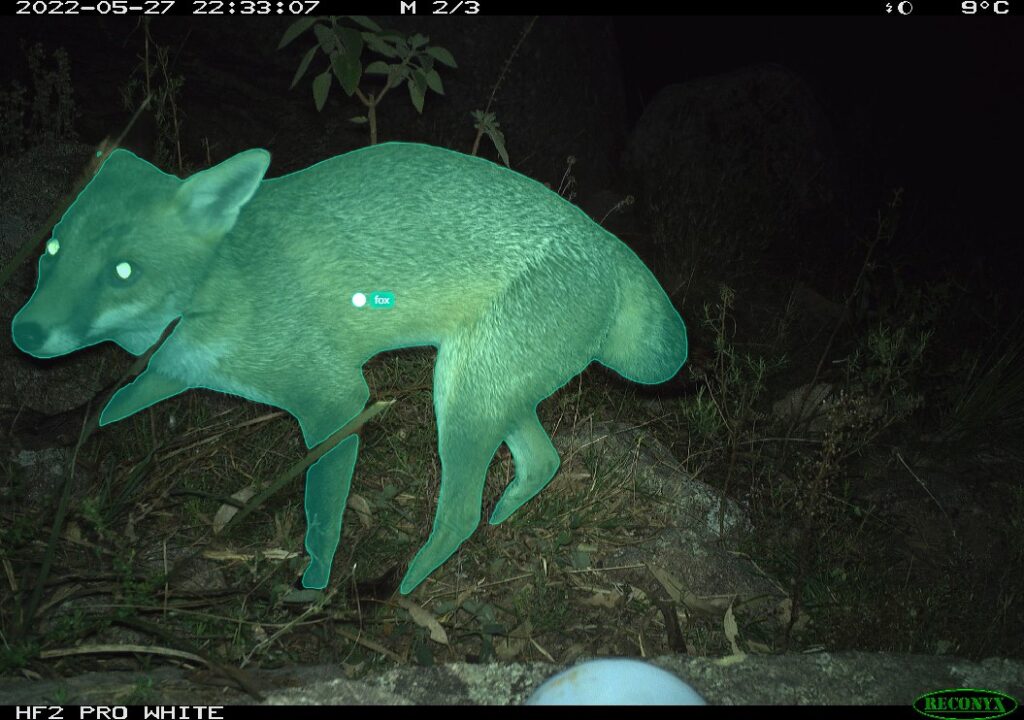
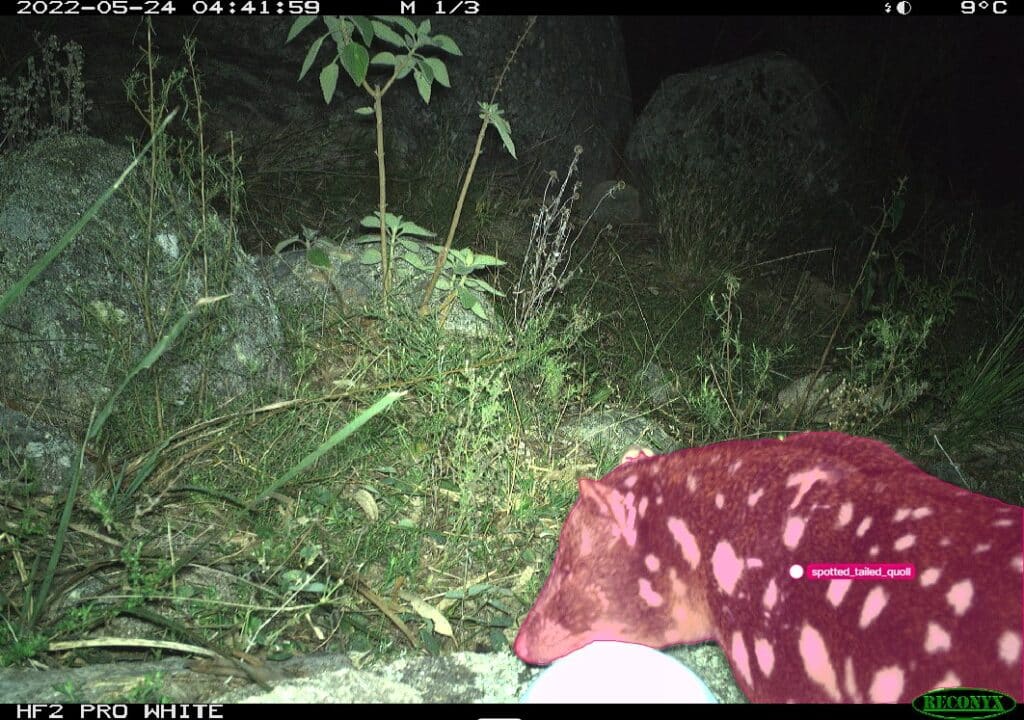
This approach allows us to rapidly process thousands of camera trap images, drone survey images, and audio recording devices. Each image or audio segment is scored between 0 and 1, with 1 indicating the highest likelihood of containing the target species. Our expert ecologists then review the top-scoring detections to confirm presence or absence. This enables a more extensive and confident search for species at a site.
Smarter Abundance Estimates with Built-In Confidence
When estimating species abundance – such as the ratio of koala calling time to total recording time – accuracy matters. First, our models process the data to produce a preliminary call ratio. Then, our ecologists determine the accuracy of the model by manually reviewing a subset of the data. Finally, we adjust the call ratio based on the model’s accuracy, giving the ‘weighted call ratio’. For example, if the model estimates that koalas are calling 10% of the time, and our ecologists determine that the model precision is 70%, we adjust the estimate accordingly, resulting in a weighted call ratio of 7%. The weighted call ratio is a proxy for abundance that blends the efficiency of our models with the expertise of our ecologists. This kind of rigour gives our clients confidence in our abundance analysis, helping them make decisions backed by data.
Smart Technology Backed by Experts
Every detection manually reviewed by our ecologists feeds back into our models, making them smarter over time. As we put out more recording devices, we get images and recordings of more species, such as the black-throated finch, the yellow-bellied glider, and the tusked frog. The result? A growing system of automated tools you can trust – making big projects small and unlocking new insights.